Estimation of glottal source spectrum by inverse radiation filter and anti-formant filter
This is a trial estimation of glottal source spectrum condition by inverse radiation filter and anti-formant filter
under following hypotheses,
a) glottal source spectrum (frequency response) characterizes simply descending rightwards without sharp peak.
b) resonance strength of formant is roughly same level, regardless of formant frequency.
And also, nose effect on glottal source spectrum condition is studied.
Glottal source frequency response
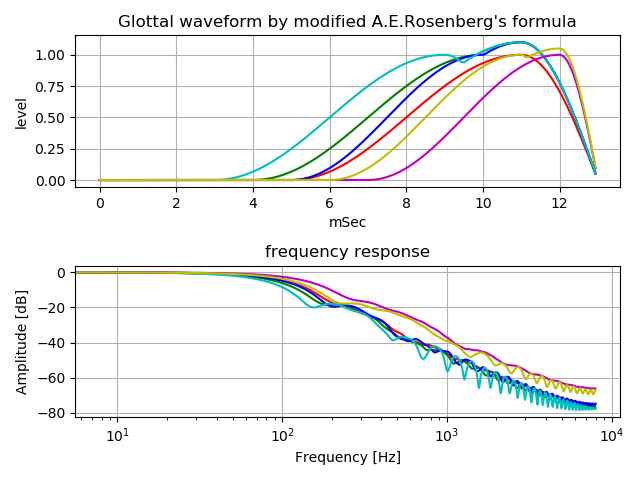
Following figure shows several pseudo glottal source waveform based on modified A.E.Rosenberg's formula, and their frequency response.
It's assumed that glottal source spectrum (frequency response) characterizes simply descending rightwards without sharp peak due to resonance effect. (hypothesis)
Vowel formant when uttered alone
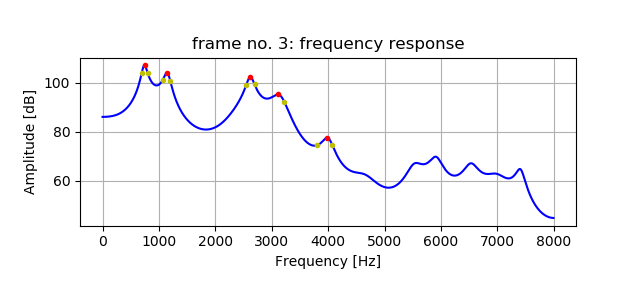
Following figure is an example of formant of vowel /a/ when uttered alone.
Yellow points shows amplitude -3dB to center peak frequency (red point) to compute Q factor of the formant.
Inverse radiation filter
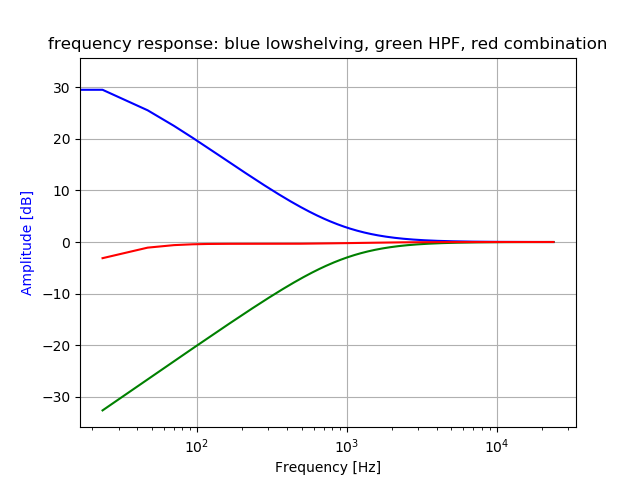
Low shelving filter is used as inverse filter against high pass filter that simulates radiation from mouth.
By using low shelving filter, needless gain boost at very low frequency can avoid.
In the following figure, green is frequency response of high pass filter that simulates radiation from mouth,
blue is of low shelving filter as inverse radiation filter, and red is overall frequency response
that is almost flat until fundamental frequency F0.
Anti-formant filter
To get rid of resonance effect, as anti-formant filter, peaking filter of which center frequency is formant frequency is used.
Following figure shows an example of peaking filter frequency response.
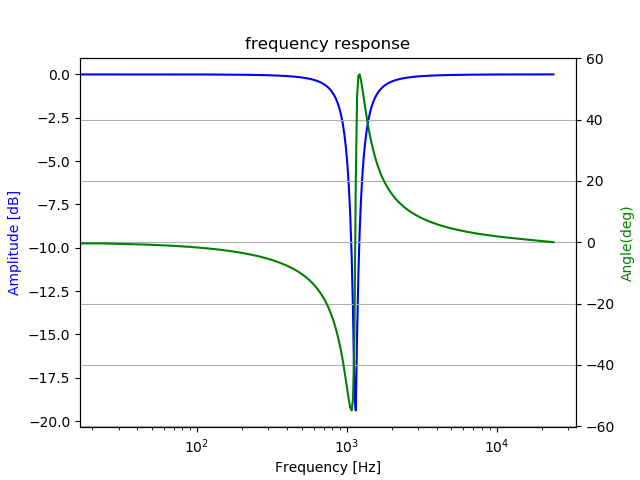
Peaking filter drop gain of every formant is set to same value (gain pattern 1)
under the hypothesis of "resonance strength of formant is roughly same level, regardless of formant frequency."
Processing of inverse radiation filter and anti-formant filter
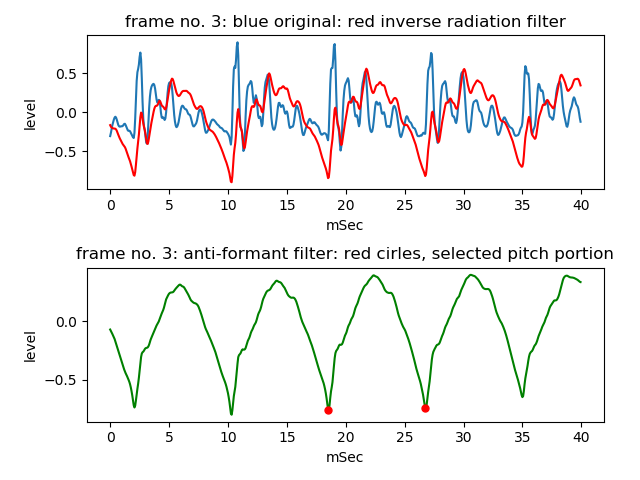
In following figure, blue waveform is utterance, red is inverse radiation filter output, and then green is anti-formant filter output.
Detection pitch duration
To get rid of influence of fundamental frequency F0 appear in frequency response, only one pitch duration waveform is necessary to estimate glottal source frequency response.
Red marked section shows one pitch, selected portion.

Estimation glottal source frequency response
It's assumed that glottal source spectrum condition may remain after process utterance in inverse radiation and anti-formant.
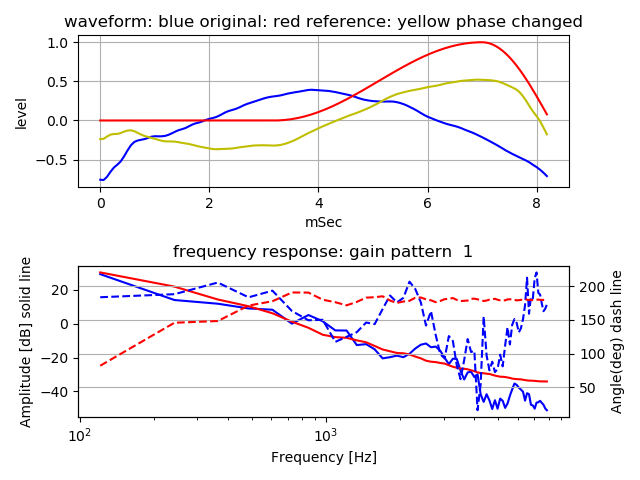
In the following figure, blue is selected one pitch waveform after process, and red is a pseudo glottal source waveform based on A.E.Rosenberg's formula, as a reference.
In the selected waveform, there is not plain bottom line that is corresponding to glottis closure section.
During transmission from glottis to out of mouth and inverse process , phase was changed and waveform shape also changed.
Waveform becomes like yellow one when only phase response is adjusted to be same as the reference,
And bottom figure is frequency response comparison of selected waveform with the reference.
Roughly, both are simple descending rightwards.
A study of nose effect (nasal voice)
Nasal voice formant
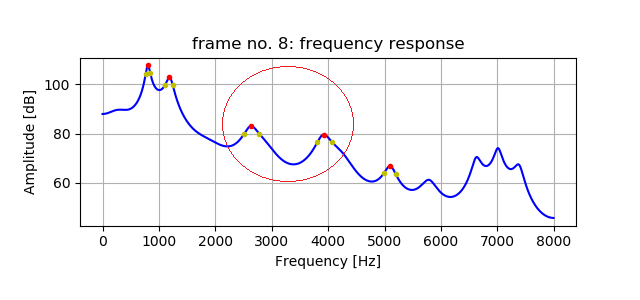
Following figure is an example of formant of vowel part /a/ when nasal sound /na/ is uttered.
Compared with formant of vowel /a/ when uttered alone, the portion shown in red circle becomes lower power.
It's assumed that energy leak from sound source to nose causes lower power.
Gain adjustment for anti-formant
Following figure is estimated glottal source frequency response under the hypothesis of
"resonance strength of formant is roughly same level, regardless of formant frequency."
But, there is deviation (showed in red circle area) to simply descending rightwards.
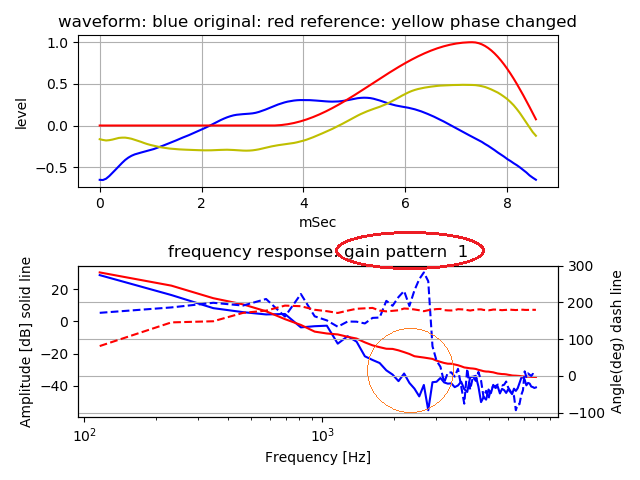
To correct the deviation, nasal effect, smaller drop gain of which frequency is above a certain frequency is adjusted.(gain pattern 2)
Following figure shows adjustment result. Deviation to descending rightwards becomes smaller.
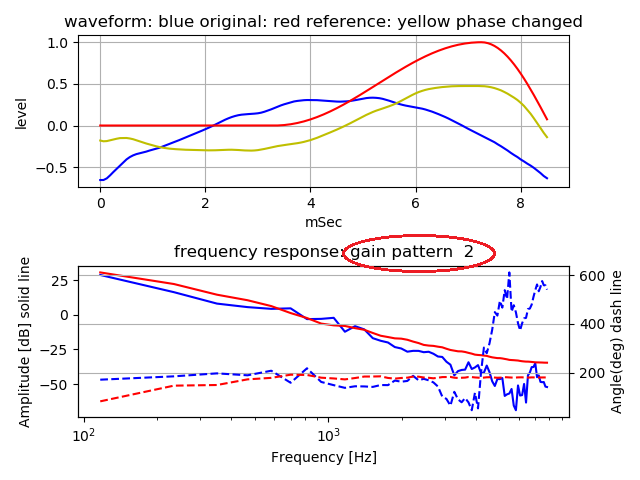
It is possible to interpret that there is source energy loss instead of weaken formant strength, smaller gain.
For reference, there is Python program to compute above waveforms by Python. Please see README.txt in the zip file about usage.
No.1b, 13 March 2019
Home page


