An example of structure identification by rough full search and nonlinear least square method
- to estimate parameters of two composite structures in signal -


Let's think about a problem that signal generator parameters estimation from observed signal. There are two kinds of signal generator. One is triangle signal generator as the same time that it generates  rectangular signal. Let's call it "Structure A." Another is amplitude modulation signal generator always with carrier signal. Let's call it "Structure B."


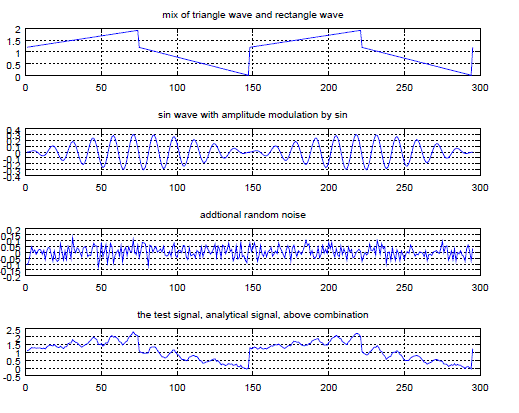
The following figure is an example of  signal waveform generated by structure A of which  frequency, f0 is 300Hz, amplitude value, height0 is 1.2, and   ratio of triangle signal to rectangular signal, ratio0 is 0.6. (sampling rate frequency  is 44.1KHz)
structure-a

The following figure is an example of  signal waveform generated by structure B of which  frequency, f0 is 300Hz, amplitude value, height0 is 0.3, and ratio of carrier frequency to amplitude modulation frequency, ratio0 is 11. In the figure, shorter wavelength  sin waveform means carrier signal. The sin form envelope of carrier signal means amplitude modulation. (sampling rate frequency  is 44.1KHz)
structure-b

The following figure is signal waveform which is composite of above two signal of each structure and additional random noise. This is test signal, analytical signal.  (sampling rate frequency  is 44.1KHz)
structure-c


Due to restriction of activities of physical production system of structure,  some limitation must exist. Let's define limited range (bounds) of parameters as following table.

Limited range (bounds)

Min
Typ
Max
Structure A, frequency, f0
100
550
1000
Structure A, amplitude value, height0
0.1
1.05
2.0
Structure A, ratio of triangle signal to
rectangular signal, ratio0
0.5
0.7
0.9
Structure B, frequency, f0
100
550
1000
Structure B, amplitude value, height0
0.1
0.55
1.0
Structure B, ratio of carrier frequency to amplitude modulation frequency, ratio0
8
10
12

For example, structure A generates triangle signal as the same time that it generates  rectangular signal. Only rectangular signal is prohibited. Triangle signal will be generated by ratio between 50 percentages and 90 percentages.


For this problem, to apply directly nonlinear least‐squares method, like quasi-Newton method, does not work well, because if initial value is far from correct answer, if it starts out of convergence zone,  result will be quite different from true value. 
So, in order to get appropriate initial value for least-squares method, all possible value should be examined.  However, avoid to huge calculation cost of whole points, to examine only some select points is a good way. Let's call this way "rough full search."
And for frequency and amplitude value, logarithm standard equally divided values shall be used. It will enable to keep practical dynamic range and reduce calculation cost reasonably. 
And, to begin with, only structure A is estimated assuming there is no structure B. After get sure estimation of structure A,  starts to consider structure B.


 ***
Below is an example of solving, using the GNU Octave numerical analysis software.


octave:1> test1
Answer: A: f0=300 height0=1.2 ratio0=0.6 B: f0=300 height0=0.3 ratio0=11          This is correct answer.


In following figures, test signal, analytical signal(last figure)  consists of signal generated by structure A (top figure),  signal generated by structure B (second figure), and random noise (third figure).
leastsqr-explain

search Structure Sample A, only                          To begin with, estimate only structure A
A: rough global search (1)                                      and ratio0 is fixed at typ value. Rough full search for f0 and hight0 was done.
A: min f0->297.635  min height0->1.2462  value=19.253     Provisional candidate what minimum square error was smallest in  rough full search
A: rough global search (2)                                           Rough full search for height0 and ratio0 was done while f0 is fixed at the provisional candidate.
A: min height0->1.2462  min ratio0->0.5  value=16.755        Provisional candidate what minimum square error was smallest in  rough full search
A: call function leastsq (3)                                         Using GNU Octave leasqr function, nonlinear parameter estimation, Levenberg-Marquardt method
A: kvg1=1  iter1=5                                                     and starts from the provisional candidate above,
A: min f0->300.677  min height0->1.1865  min ratio0->0.656         result of structure A parameters, f0, height0, and ratio0.


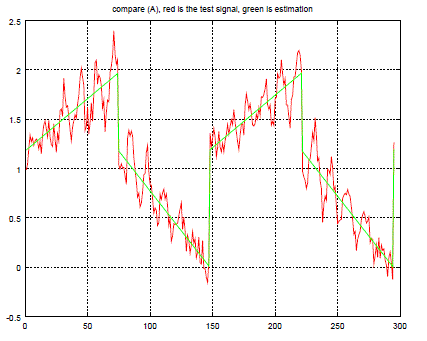
The following figure is comparison of signal waveform, red line is test signal and green line is calculation based on estimated parameters of the structure A.
leastsqr-2


search Structure Sample B, while Structure Sample A is fixed         Next time, estimate structure B while parameters of structure A are provisional candidate above.
B: rough global search (4)                                                and ratio0 is fixed at typ value. Rough full search for f0 and hight0 was done.
B: min f0->335.982  min height0->0.1  value=8.1092     Provisional candidate what minimum square error was smallest in  rough full search
B: rough global search (5)                                                  Rough full search for height0 and ratio0 was done while f0 is fixed at the provisional candidate.
B: min height0->0.26367  min ratio0->9.7778  value=4.0194   Provisional candidate what minimum square error was smallest in  rough full search
B: call function leastsq (6)                                                  Using GNU Octave leasqr function
B: kvg2=1  iter2=14                                                            and starts from the provisional candidate above,
B: f0=305.04 height0=0.29549 ratio0=10.82                  result of structure B parameters, f0, height0, and ratio0.


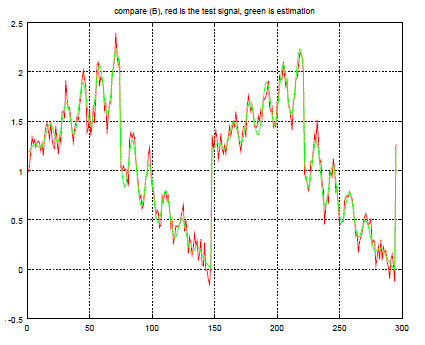
The following figure is comparison of signal waveform, red line is test signal and green line is calculation based on estimated parameters of the structure B.
leastsqr-b


search Structure Sample A and B, at once                          
A+B: call function leastsq (7)                               Using GNU Octave leasqr function
A+B: kvg2=1  iter2=14                                         and starts from every provisional candidate above of structure A and structure B,
A+B: A: f0=300.679 height0=1.1866 ratio0=0.65568B: f0=305.04 height0=0.2955 ratio0=10.82    result of structure A parameters, f0, height0, ratio0 and structure B parameters, f0, height0, ratio0.


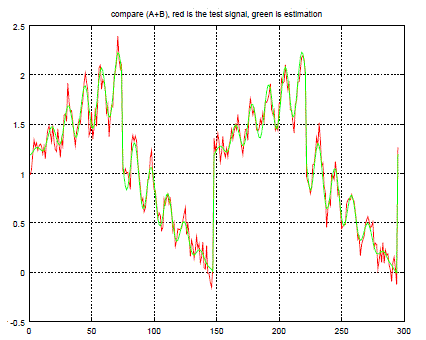
The following figure is comparison of signal waveform, red line is test signal and green line is calculation based on estimated parameters of both structure A and the structure B.
figure4


 ***
The following program is the GNU Octave program used here. There is absolutely no warranty. It needs also extra package Optim, non-linear optimization toolkit.

>cat test1.m

%//
%//   use for GNU Octave version 3.6.4 and version 3.8.1
%//
%//------------------------------------------------------
%// WARNING: There is ABSOLUTELY NO WARRANTY in this program.
%// If you use this program, everyhing will be done by your own risk.
%//
1;   %// This is not a function file:
%////////////////////////////////////////////////////
%////////////////////////////////////////////////////
function y=rec_tri(f0, height0, ratio0)
%//
%//   Struture Sample A: mix of rectangle wave and triangle wave
%//
%//
%//   Fs is sampling frequecny [Hz]
%//   f0 is the target frequecny
%//   height0 is height from zero, rectangle value
%//   ratio0 is  ratio of triangle wave vs rectangle 
%//===================================================
%//    restricting condition due to this structure
%//         0.5 < ratio0 < 0.9
%//===================================================

global Fs;
global Size0

wl0= Fs/f0;
wlh0=wl0/2.0;
a=height0/wlh0;
b=height0;

y=zeros(Size0,1);

for i=1:Size0
   x= (i-1);
   x=  x - (fix(x/wl0)) * wl0;
  
   if (x <= wlh0)   %// if x <= wlh0 then
     y(i)= b + ratio0 * (a * x);
   else
     y(i)= -1.0 * a * (x - wlh0) + b;
  endif  %// end
end

endfunction
%////////////////////////////////////////////////////////
%////////////////////////////////////////////////////
%////////////////////////////////////////////////////
function y=sin_sin(f0, height0, ratio0)
%//
%//   Struture Sample B: sin wave with AM modulation by sin
%//
%//
%//   Fs is sampling frequecny [Hz]
%//   f0 is AM modulation frequecny (per one pulse)
%//   height0 is height from zero, sin
%//   ratio0 is  ratio of carrier frequecny vs f0
%//===================================================
%//    restricting condition due to this structure
%//         8 < ratio0 < 12
%//===================================================
global Fs;
global Size0;

f0c=f0 * ratio0;  %// carrier
wl0= Fs/f0c; 
b=height0;
fmod0=f0 / 2; %// down to half, to be similar to triangle wave  of Structure Sample A
wlm0= Fs/fmod0;

y=zeros(Size0,1);
d0=2 * pi *  (f0c / Fs);
dmod0=2 * pi * (fmod0 / Fs);

for i=1:Size0
   x= (i-1);
   xm=x;
   x=  x - (fix(x/wl0)) * wl0;
   xm= xm - (fix(x/wlm0)) * wlm0;
  
   y(i)=b * sin( d0 * x) * abs( sin( dmod0 * xm)); 

end

endfunction
%////////////////////////////////////////////////////////
%////////////////////////////////////////////////////
%////////////////////////////////////////////////////
function  y=myfunc(xin,p)
%// ignore xin, output size is always Size0
global Fs;
global Size0;
global p_global;
global para_quant;
global AB_switch0;

l0=length(p);
p_global2=p_global;

if( l0 == para_quant)
 for i=1:l0
   p_global2(i)=p(i);
 end
else
 for i=1:l0
   p_global2(i + AB_switch0 * 3)=p(i);   %// When AB_switch0 is 1, B side.  When AB_switch0 is 0, A side.
 end
end


y=zeros(Size0,1);

%// (1) Structure sample A
f0=p_global2(1);
height0=p_global2(2);
ratio0=p_global2(3);

wl0= Fs/f0;
wlh0=wl0/2.0;
a=height0/wlh0;
b=height0;

for i=1:Size0
x= (i-1);
x=  x - (fix(x/wl0)) * wl0;
  
if (x <= wlh0)   %// if x <= wlh0 then
     y(i)= b + ratio0 * (a * x);
else
     y(i)= -1.0 * a * (x - wlh0) + b;
endif  %// end
end

%// (2) Structure sample B
f0=p_global2(4);
height0=p_global2(5);
ratio0=p_global2(6);

f0c=f0 * ratio0;  %// carrier
wl0= Fs/f0c; 
b=height0;
fmod0=f0 / 2; %// down to half, to be similar to triangle wave  of Structure Sample A
wlm0= Fs/fmod0;

d0=2 * pi *  (f0c / Fs);
dmod0=2 * pi * (fmod0 / Fs);


for i=1:Size0
x= (i-1);
xm=x;
x=  x - (fix(x/wl0)) * wl0;
xm= xm - (fix(x/wlm0)) * wlm0;
  
y(i)=y(i)+b * sin( d0 * x) * abs( sin( dmod0 * xm)); 

end

endfunction
%////////////////////////////////////////////////////////
%////////////////////////////////////////////////////////
%////////////////////////////////////////////////////////
%// COMMON DEFINITION
global Fs;
global Span0;
global Size0;
Fs=44100;
Span0=2;

global p_global;
global para_quant;
para_quant=6;  %// Please set parameters quantity
p_global=zeros(para_quant,1); 

%//bounds control
minstep0 = [ 100; 0.1; 0.5;  100; 0.1; 8];
maxstep0 = [1000; 2.0;  0.9;  1000; 1.0; 12];


global AB_switch0;
AB_switch0=0;    %// When AB_switch0 = 0, then A side, other B side In myfunc
%////////////////////////////////////////////////////////
%////////////////////////////////////////////////////////
%////////////////////////////////////////////////////////
%// make a test signal
%//
%// (1) apply Structure sample A
f1=300;
height1=1.2;
ratio1=0.6;   %// ratio1 must be in range of restricting condition due to structure sample A
Size0=fix(Span0 * Fs/f1)+1;
y1=rec_tri(f1, height1, ratio1);
%//
%// (2) aply Strutrue sample B
f2=300;
height2=0.3;
ratio2=11;  %// ratio2 must be in range of restricting condition due to structure sample B
y2=sin_sin(f2, height2, ratio2);
%//
%// (3) and add random noise
seed0=0;
height3=0.1;
randn('seed', seed0);
yran1= randn(Size0,1) *  height3;


%// combination: this is the test signal, analytical signal
yall=y1+y2+yran1;


%////////////////////////////////////////////////////////
%// show grpah
figure(1);
clf;
subplot(4, 1, 1);
plot( y1 );
title("mix of triangle wave and rectangle wave");
grid "on";
subplot(4, 1, 2);
plot( y2 );
title("sin wave with amplitude modulation by sin");
grid "on";
subplot(4, 1, 3);
plot( yran1 );
title("addtional random noise");
grid "on";
subplot(4, 1, 4);
plot( yall );
title("the test signal, analytical signal, above combination");
grid "on";

%////////////////////////////////////////////////////////
%////////////////////////////////////////////////////////
%////////////////////////////////////////////////////////
%//  Search
%//
p_kai=[f1;  height1;  ratio1; f2;  height2;  ratio2;];
disp([ "Answer: A: f0=", num2str(p_kai(1)) ," height0=", num2str(p_kai(2)), " ratio0=", num2str(p_kai(3)), " B: f0=", num2str(p_kai(4)) ," height0=", num2str(p_kai(5)), " ratio0=", num2str(p_kai(6)) ]);


xin=1:Size0;
xin=xin';
%////////////////////////////////////////////////////////
%// set tentative value
f10=(maxstep0(1)-minstep0(1))/2+minstep0(1);
height10=(maxstep0(2)-minstep0(2))/2+minstep0(2);
ratio10=(maxstep0(3)-minstep0(3))/2+minstep0(3);
f20=(maxstep0(4)-minstep0(4))/2+minstep0(4);
height20=(maxstep0(5)-minstep0(5))/2+minstep0(5);
ratio20=(maxstep0(6)-minstep0(6))/2+minstep0(6); 
p_global=[f10;  height10;  ratio10; f20;  height20;  ratio20;]; 


%////////////////////////////////////////////////////////
%// set global search range
f1_BUNKATU=20;
lf0=log10(minstep0(1));
df0=(log10(maxstep0(1)) - log10(minstep0(1))) / (f1_BUNKATU-1);
f_list1=zeros(f1_BUNKATU,1);   %// list for the A f0
for i=1:f1_BUNKATU
  f_list1(i)=10^(lf0 + df0 * (i-1));
end

h1_BUNKATU=20;
lf0=log10(minstep0(2));
df0=(log10(maxstep0(2)) - log10(minstep0(2))) / (h1_BUNKATU-1);
h_list1=zeros(h1_BUNKATU,1);   %// list for the A heigh0
for i=1:h1_BUNKATU
  h_list1(i)=10^(lf0 + df0 * (i-1));
end

r1_BUNKATU=10;
lf0=minstep0(3);
df0=(maxstep0(3) - minstep0(3)) / (r1_BUNKATU-1);
r_list1=zeros(r1_BUNKATU,1);   %// list for the A ratio0
for i=1:r1_BUNKATU
  r_list1(i)=lf0 + df0 * (i-1);
end

f2_BUNKATU=20;
lf0=log10(minstep0(4));
df0=(log10(maxstep0(4)) - log10(minstep0(4))) / (f2_BUNKATU-1);
f_list2=zeros(f2_BUNKATU,1);   %// list for the B f0
for i=1:f2_BUNKATU
  f_list2(i)=10^(lf0 + df0 * (i-1));
end

h2_BUNKATU=20;
lf0=log10(minstep0(5));
df0=(log10(maxstep0(5)) - log10(minstep0(5))) / (h2_BUNKATU-1);
h_list2=zeros(h2_BUNKATU,1);   %// list for the B heigh0
for i=1:h2_BUNKATU
  h_list2(i)=10^(lf0 + df0 * (i-1));
end

r2_BUNKATU=10;
lf0=minstep0(6);
df0=(maxstep0(6) - minstep0(6)) / (r2_BUNKATU-1);
r_list2=zeros(r2_BUNKATU,1);   %// list for the B ratio0
for i=1:r2_BUNKATU
  r_list2(i)=lf0 + df0 * (i-1);
end


%//////////////////////////////////////////////////////////////////////
%// 
%// search Structure Sample A, only
%//
%// (1)rough global search of Structure Sample A, f0 and height0, only

disp(["search Structure Sample A, only"]);
AB_switch0=0; %// set A
CAL_FLAG1=1;  %//<----- SET CONTROL FLAG
if (CAL_FLAG1 == 1) %//if (CAL_FLAG = 1)

hf_value1=zeros(h1_BUNKATU , f1_BUNKATU);
p=[f10;  height10;  ratio10; f20;  0;  ratio20;];  %// height20 is zero, due to B is zero

disp(["A: rough global search (1)"]);
for i=1:h1_BUNKATU
 for j=1:f1_BUNKATU
    p(1)=f_list1(j);
    p(2)=h_list1(i);
    y=myfunc(xin,p);
    hf_value1(i,j)= sumsq( (y - yall)' );
 end  %// j
end  %// i

  save data01.mat hf_value1;

else  %//if (CAL_FLAG = 1)

  load data01.mat hf_value1;

end   %//if (CAL_FLAG = 1)

%// find minimum
[v0, r0]=min( hf_value1);
[v1, pf0]=min(v0);
ph0=r0(pf0);
disp(["A: min f0->", num2str(f_list1(pf0)) , "  min height0->", num2str(h_list1(ph0)), "  value=", num2str(v1)]);


%//////////////////////////////////
%// (2)rough global search of Structure Sample A, height0 and ratio0, when f0 is fixed

CAL_FLAG2=1;  %//<----- SET CONTROL FLAG
if (CAL_FLAG2 == 1) %//if (CAL_FLAG = 1)

hr_value1=zeros(h1_BUNKATU , r1_BUNKATU);
p=[f_list1(pf0);  height10;  ratio10; f20;  0;  ratio20;];  %// height20 is zero, due to B is zero

disp(["A: rough global search (2)"]);
for i=1:h1_BUNKATU
 for j=1:r1_BUNKATU
    p(2)=h_list1(i);
    p(3)=r_list1(j);
    y=myfunc(xin,p);
    hr_value1(i,j)= sumsq( (y - yall)' );
 end  %// j
end  %// i

  save data02.mat hr_value1;

else  %//if (CAL_FLAG = 1)

  load data02.mat hr_value1;

end   %//if (CAL_FLAG = 1)

%// find minimum
[v0, r0]=min( hr_value1);
[v1, pr0]=min(v0);
ph0=r0(pr0);
disp([ "A: min height0->", num2str(h_list1(ph0)), "  min ratio0->", num2str(r_list1(pr0)) , "  value=", num2str(v1)]);

%//////////////////////////////////
%// (3)call function leastsq,  start from rough global serach

CAL_FLAG3=1; %//<----- SET CONTROL FLAG
if (CAL_FLAG3 == 1)    %//if (CAL_FLAG = 1)

disp(["A: call function leastsq (3)"]);
p_global=[f_list1(pf0); h_list1(ph0);  r_list1(pr0); f20;  0;  ratio20;];    %// height20 is zero, due to B is zero
p_init=[f_list1(pf0); h_list1(ph0);  r_list1(pr0);];  %// height20 is zero, due to B is zero
stol0=0.001; %//tolerance, scalar
niter0=20;   %//max repeat kaisuu
wt1=ones(size(yall));  %// omomi

dp0 = [0.01; 0.001; 0.001;]; % tolerance of dfdp
%//bounds control
minstep1 = minstep0(1:3,1);
maxstep1 = maxstep0(1:3,1);
options.bounds=   [minstep1, maxstep1];
%load filter package to call leastsqr
pkg load optim;

[fout1, pout1, kvg1, iter1] =leasqr (xin, yall, p_init, "myfunc", stol0, niter0, wt1, dp0, "dfdp", options);

disp(["A: kvg1=", num2str(kvg1), "  iter1=", num2str(iter1)]);   %// kvg1 = 1 , Scalar: = 1, then success

save data03.mat pout1;

else  %//if (CAL_FLAG = 1)

load data03.mat pout1;

end   %//if (CAL_FLAG = 1)

disp([ "A: min f0->", num2str(pout1(1)) ,"  min height0->", num2str(pout1(2)), "  min ratio0->", num2str(pout1(3)) ]);


%////////////////////////////////////////////////////////
%// show grpah
p_global=[pout1(1); pout1(2); pout1(3); f20;  0;  ratio20;];    %// height20 is zero, due to B is zero
fout1=myfunc(xin,p_global);


figure(2);
clf;
hold on   % over-write
plot( yall, "r");
plot( fout1, "g");
hold off %
title("compare (A), red is the test signal, green is estimation");
grid "on";


%//
fflush(stdout);   %// flush output
%//////////////////////////////////////////////////////////////////////
%// 
%// search Structure Sample B, while Structure Sample A is fixed
%//
%// (4)rough global search of Structure Sample B, f0 and height0, only

disp(["search Structure Sample B, while Structure Sample A is fixed"]);
AB_switch0=1; %// set B
CAL_FLAG4=1;  %//<----- SET CONTROL FLAG
if (CAL_FLAG4 == 1) %//if (CAL_FLAG = 1)

hf_value2=zeros(h2_BUNKATU , f2_BUNKATU);
p=[pout1(1);  pout1(2);  pout1(3); f20;  height20;  ratio20;]; 

disp(["B: rough global search (4)"]);
for i=1:h2_BUNKATU
 for j=1:f2_BUNKATU
    p(4)=f_list2(j);
    p(5)=h_list2(i);
    y=myfunc(xin,p);
    hf_value2(i,j)= sumsq( (y - yall)' );
 end  %// j
end  %// i

  save data04.mat hf_value2;

else  %//if (CAL_FLAG = 1)

  load data04.mat hf_value2;

end   %//if (CAL_FLAG = 1)

%// find minimum
[v0, r0]=min( hf_value2);
[v1, pf1]=min(v0);
ph1=r0(pf1);
disp(["B: min f0->", num2str(f_list2(pf1)) , "  min height0->", num2str(h_list2(ph1)), "  value=", num2str(v1)]);


%//////////////////////////////////
%// (5)rough global search of Structure Sample B, height0 and ratio0, when f0 is fixed

CAL_FLAG5=1;  %//<----- SET CONTROL FLAG
if (CAL_FLAG5 == 1) %//if (CAL_FLAG = 1)

hr_value2=zeros(h2_BUNKATU , r2_BUNKATU);
p=[pout1(1);  pout1(2);  pout1(3); f_list2(pf1);  height20;  ratio20;]; 

disp(["B: rough global search (5)"]);
for i=1:h2_BUNKATU
 for j=1:r2_BUNKATU
    p(5)=h_list2(i);
    p(6)=r_list2(j);
    y=myfunc(xin,p);
    hr_value2(i,j)= sumsq( (y - yall)' );
 end  %// j
end  %// i

  save data05.mat hr_value2;

else  %//if (CAL_FLAG = 1)

  load data05.mat hr_value2;

end   %//if (CAL_FLAG = 1)

%// find minimum
[v0, r0]=min( hr_value2);
[v1, pr1]=min(v0);
ph1=r0(pr1);
disp([ "B: min height0->", num2str(h_list2(ph1)), "  min ratio0->", num2str(r_list2(pr1)) , "  value=", num2str(v1)]);


%//////////////////////////////////////////////////////////////////////
%//
%// (6)call function leastsq,  start from rough global serach

CAL_FLAG6=1; %//<----- SET CONTROL FLAG
if (CAL_FLAG6 == 1)    %//if (CAL_FLAG = 1)

disp(["B: call function leastsq (6)"]);
p_global=[pout1(1); pout1(2);  pout1(3); f_list2(pf1); h_list2(ph1);  r_list2(pr1);];   
p_init=[ f_list2(pf1); h_list2(ph1);  r_list2(pr1);];

stol0=0.001; %//tolerance, scalar
niter0=20;   %//max repeat kaisuu
wt1=ones(size(yall));  %// omomi

dp0 = [ 0.01; 0.001; 0.001;]; % tolerance of dfdp
%//bounds control
minstep1 = minstep0(4:6,1);
maxstep1 = maxstep0(4:6,1);
options.bounds=   [minstep1, maxstep1];
%load filter package to call leastsqr
pkg load optim;

[fout2, pout2, kvg2, iter2] =leasqr (xin, yall, p_init, "myfunc", stol0, niter0, wt1, dp0, "dfdp", options);

disp(["B: kvg2=", num2str(kvg2), "  iter2=", num2str(iter2)]);   %// kvg1 = 1 , Scalar: = 1, then success

save data06.mat pout2;

else  %//if (CAL_FLAG = 1)

load data06.mat pout2;

end   %//if (CAL_FLAG = 1)


disp(["B: f0=",num2str(pout2(1))," height0=",num2str(pout2(2))," ratio0=",num2str(pout2(3))]); 


%////////////////////////////////////////////////////////
%// show grpah
p_global=[pout1(1); pout1(2); pout1(3); pout2(1); pout2(2); pout2(3);];   
fout1=myfunc(xin,p_global);


figure(3);
clf;
hold on   % over-write
plot( yall, "r");
plot( fout1, "g");
hold off %
title("compare (B), red is the test signal, green is estimation");
grid "on";

%//
fflush(stdout);  %// flush output
%//////////////////////////////////////////////////////////////////////
%// 
%// search Structure Sample A and B, at once
%//
%//
%// (7)call function leastsq,  after each leastsq
disp(["search Structure Sample A and B, at once"]);
CAL_FLAG7=1; %//<----- SET CONTROL FLAG
if (CAL_FLAG7 == 1)    %//if (CAL_FLAG = 1)

disp(["A+B: call function leastsq (7)"]);
p_global=[pout1(1); pout1(2); pout1(3); pout2(1); pout2(2); pout2(3);];   
p_init=[pout1(1); pout1(2); pout1(3); pout2(1); pout2(2); pout2(3);];

stol0=0.001; %//tolerance, scalar
niter0=20;   %//max repeat kaisuu
wt1=ones(size(yall));  %// omomi

dp0 = [ 0.01; 0.001; 0.001; 0.01; 0.001; 0.001;]; % tolerance of dfdp
%//bounds control
minstep1 = minstep0(1:6,1);
maxstep1 = maxstep0(1:6,1);
options.bounds=   [minstep1, maxstep1];
%load filter package to call leastsqr
pkg load optim;

[fout3, pout3, kvg3, iter3] =leasqr (xin, yall, p_init, "myfunc", stol0, niter0, wt1, dp0, "dfdp", options);

disp(["A+B: kvg2=", num2str(kvg2), "  iter2=", num2str(iter2)]);   %// kvg1 = 1 , Scalar: = 1, then success

save data07.mat pout3;

else  %//if (CAL_FLAG = 1)

load data07.mat pout3;

end   %//if (CAL_FLAG = 1)


disp(["A+B: A: f0=",num2str(pout3(1))," height0=",num2str(pout3(2))," ratio0=",num2str(pout3(3)),"B: f0=",num2str(pout3(4))," height0=",num2str(pout3(5))," ratio0=",num2str(pout3(6))]); 


%////////////////////////////////////////////////////////
%// show grpah
p_global=[pout3(1); pout3(2); pout3(3); pout3(4); pout3(5); pout3(6);];   
fout1=myfunc(xin,p_global);


figure(4);
clf;
hold on   % over-write
plot( yall, "r");
plot( fout1, "g");
hold off %
title("compare (A+B), red is the test signal, green is estimation");
grid "on";


Home Page

No.1, 16  February 2015