Band Pass Filter bank and its application to voice sound analysis
Band Pass Filter bank is a set of band pass filters of which pass band center frequency is a series of value. (Hereinafter band pass filter is referred to as BPF.)
In order to study voice sound condition over 2kHz frequency,
BPF bank output is visualized as a gray scale image.
And as its application, estimation of noise source condition and resonance strength is described.
Estimation of vocal tract as two tubes model is also described.
Voice BPF bank analysis
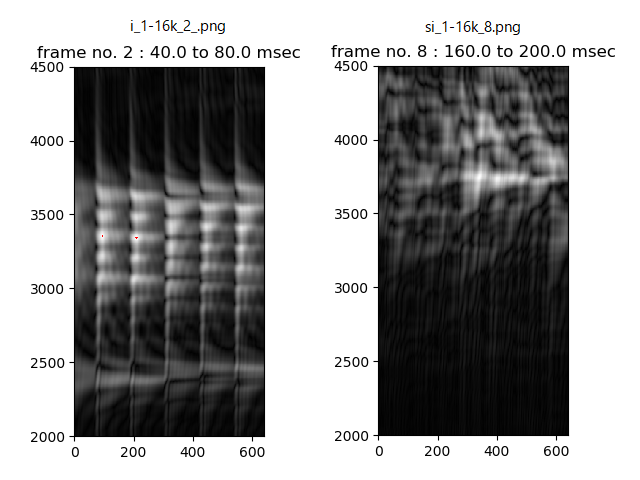
Following figure is that processing band pass filters of which pass band center frequency is from 2000Hz to 4500Hz step by 5Hz and shows gray scale image that is equivalent to BPF output waveform envelop converted into gray scale value from 0 to 255.
In order to reduce effect by lower frequency band like F0 and F1, input voice signal is pre-processed by 800Hz high pass filter.
Left gray scale image shows a part (a frame) of vowel voice /i/ when utterance alone, and right one shows a part of consonant portion of friction voice /si/.
In case of vowel voice /i/, periodic intensity (black and white) is seen on both frequency axis and time axis. Cause of periodic intensity on time axis is by voice pitch (fundamental frequency F0) and cause of periodic intensity on frequency axis is considered by resonance in mouth, that is called as formants.
In case of consonant portion of friction voice /si/, over 3kHz signal are generated irregularly.
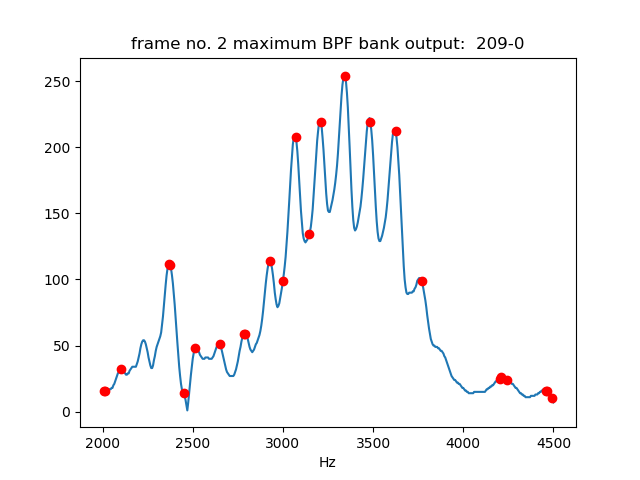
Let's look in detail to focus on maximum value point in the part (frame) of vowel voice /i/.
(In left grayscale figure, red shows strong points of which value is more than 250.)
Following figure is frequency response along frequency axis at the maximum value point. A wide mountain-shape spectrum of which center is around 3340Hz and some locally sharp peaks are seen.
And next figure is BPF (3340Hz) output envelop along time axis at the maximum value point. The envelop shape is consisted of a series of bust wave, that is synchronized with the pitch.
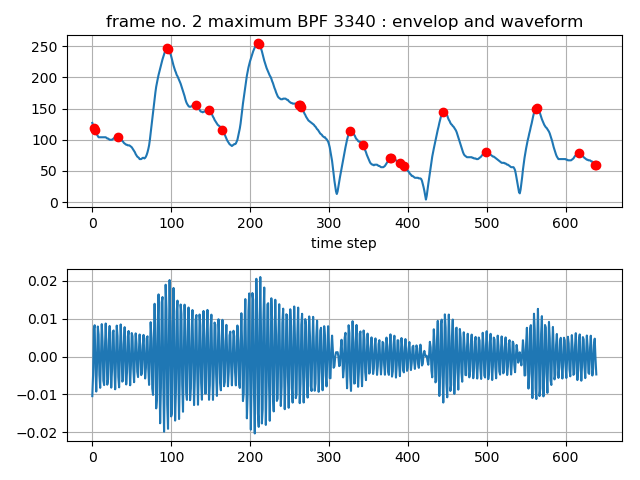
Let's think about sound source to cause the wide mountain-shape spectrum of which center is around 3340Hz in the above frequency response.
As sound source, glottal pulse source and turbulent sound source can be choice as either or both.
In general, spectrum spreads out (spectral leakage) because the waveform has a non-constant shape (in this case, a series of bust wave).
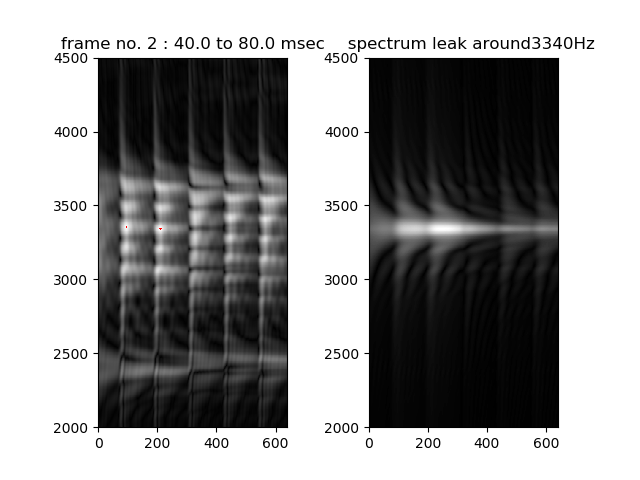
When signal has a wider band spectrum than expected spectral leakage caused on the envelop, there is a possibility that turbulent sound source, noise source, is generated.
In the following figure, left side is reference voice gray scale image and right one is computed spectral leakage gray scale image of pure sin wave of which envelop has as same as reference voice BPF (3340Hz) output.
Since the wide mountain-shape spectrum might be wider than spectral leakage of signal corresponding to formants (F2, F3), it is assumed that turbulent flow source also was generated.
Estimation of noise source condition and resonance strength
Let's assume that noise source occurs caused on turbulent flow and
some signal are strengthened due to resonance in mouth.
Estimation is to fit Gaussian distribution on mountain-shape spectrum of BPF bank output.
Following figure is fit result to the vowel voice /i/,
red dashed line shows estimated Gaussian distribution and number aside locally sharp peak shows resonance strength.
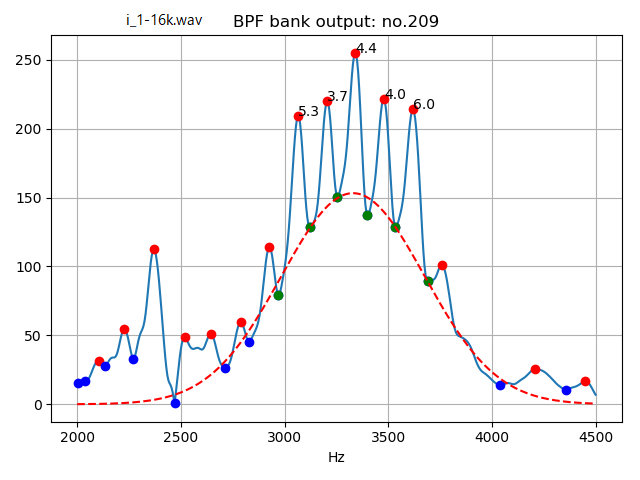
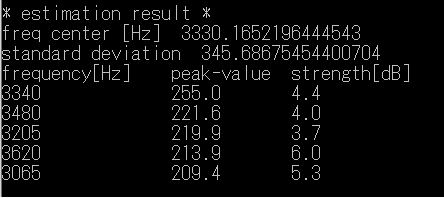
As a Gaussian distribution, center frequency, standard deviation can be computed.
In this document, resonance peak strength is evaluated by how many dB bigger than estimated Gaussian distribution value.
Following is the result.
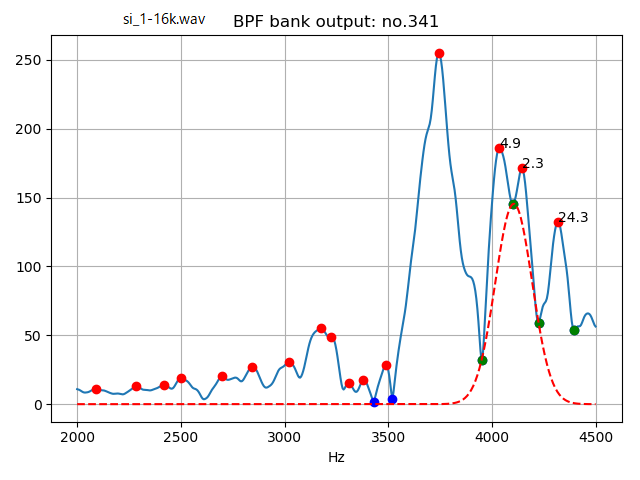
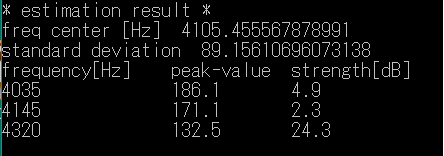
Similarly, result of the consonant portion of friction voice /si/ is as follows.
Estimation of vocal tract
Two tubes model is a very simplified model of vocal tract, that is identified by few parameters, tube length and tube cross-section area.
Estimation is to find suitable parameters whose peak and drop-peak frequencies value are as close as possible, comparing frequency response over 2kHz of real voice and two tubes model.
Following figure lower shows estimated length and cross-section area about the vowel voice /i/ as vocal tract approximation.
In the frequency response, red dot shows peak (this is sometime called formant frequency) and blue dot shows local bottom (here, it's called as drop-peak).
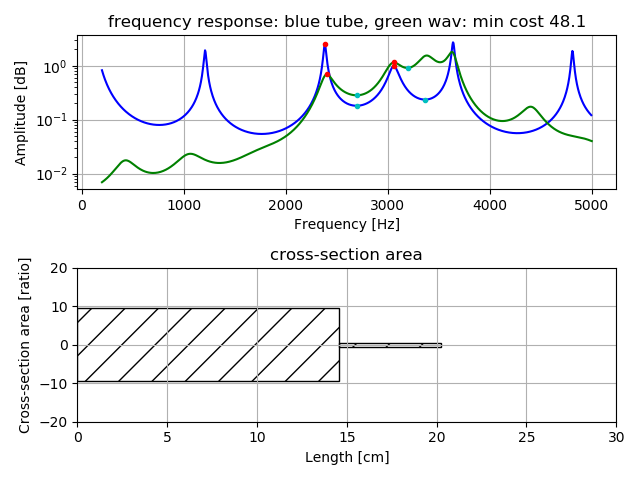
Please see Estimation of vocal tract as two tubes model or three tubes model for details.
For reference, there is Python program to compute above by Python. Please see README.txt in the zip file about usage.
No.1, 24 April 2019
Home page